
Exam and Assessment Results
Information from the Department for Education:
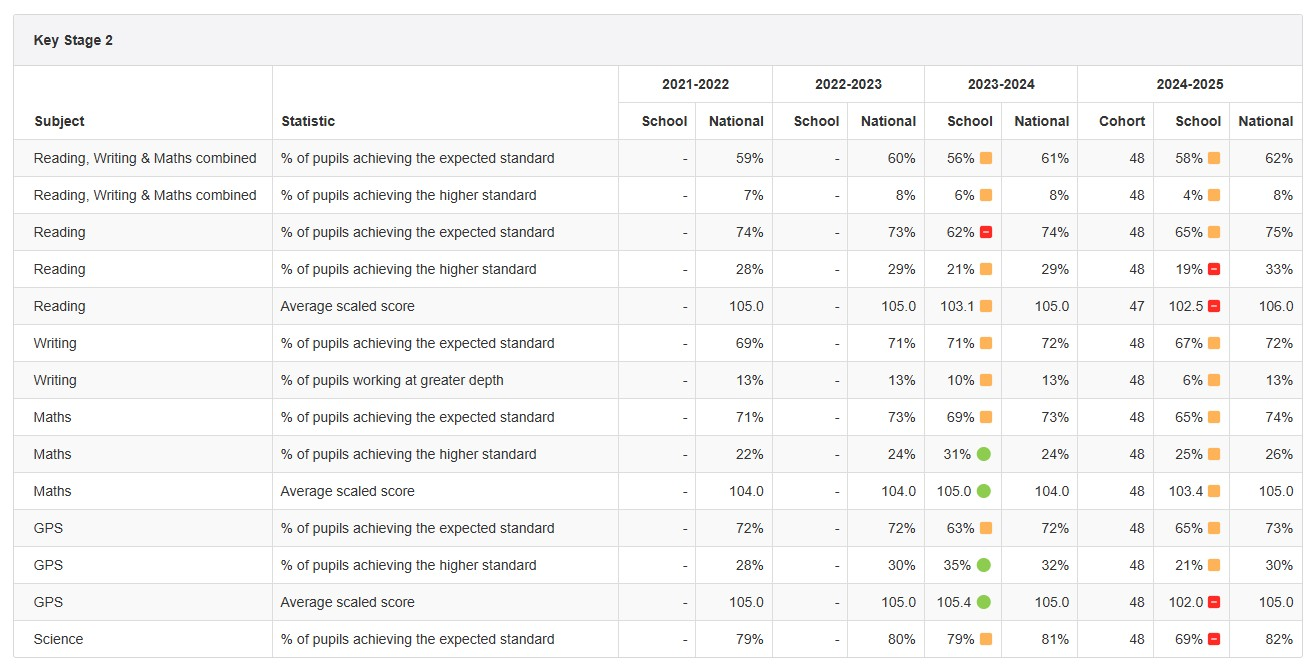
Key stage 2 (end of primary school) results
All schools must publish a link to the compare school and college performance service and their performance measures page on it.
Key stage 2
Primary schools must publish their most recent key stage 2 performance measures, as published by the Secretary of State, comprising:
- the percentage of their pupils who achieved the expected standard in reading, writing and maths (combined)
- the percentage of their pupils who achieved a higher standard in reading, writing and maths (combined)
- their pupils’ average scaled score in:
- reading
- maths
It will not be possible to calculate key stage 1 to key stage 2 progress measures for 2023 to 2024 or 2024 to 2025 academic years. This is because there is no key stage 1 baseline available to calculate primary progress measures for these years, because of Covid disruption.
For the 2023 to 2024 academic year, primary schools do not have to publish progress scores in reading, writing or maths, as the Secretary of State is not publishing these.
July 2018 Results
Our KS2 results are all above national except for Greater Depth in Reading. Which is a key area of focus for improvement across the school this year.
In KS1 our overall figures are in line with national as the percentage difference is less than one child. How we teach phonics has been changed this year to overcome this dip in data.
| School | National | ||||
| EYFS Good Level of Development | 74.4 | 70.7 (2017 figure) | |||
| Phonics Y1 | 76.5 | 81.2 (2017 figure) | |||
| Expected or higher | Greater Depth | Expected or higher | Greater Depth | Progress | |
| KS1 Reading, Writing and Maths | 63.2 | 15.8 | 64 | 11 | |
| KS1 Reading | 76.3 | 28.9 | 76 | 25 | |
| KS1 Writing | 65.8 | 18.4 | 68 | 16 | |
| KS1 Maths | 71.1 | 23.7 | 75 | 21 | |
| KS2 Reading, Writing and Maths | 73.3 | 10 | 64 | 8.6 | |
| KS2 Reading | 86.7 | 16.7 | 75 | 25.2 | -1.8 |
| KS2 Writing | 90 | 30 | 78 | 17.7 | -0.8 |
| KS2 Maths | 80 | 20 | 76 | 22.5 | -1.6 |
| KS2 Grammar, Punctuation and Spelling | 86.7 | 30 | 78 | 30.8 | |
| Average Scale Scores | |||||
| Reading | 105 | 105 | |||
| Maths | 106 | 106 | |||
| Writing | 104 | 104 |
July 2019 Results
Attainment is above or inline with national figures throughout all areas of assessment. Our work on improving Greater Depth at Year 6 was sucessful. Changes to phonics teaching has had a positive impact and ensured improvement compared to last year.
|
|
2019 |
|
|||
|
|
School |
National 2018 figures |
Progress |
||
|
GLD |
71 |
71.5 |
|
||
|
Phonics Y1 |
83 |
83 |
|
||
|
|
Exp |
GDS |
Exp |
GDS |
|
|
KS1 RWM |
64 |
15 |
64 |
11 |
|
|
KS1 Reading |
79 |
27 |
75 |
26 |
|
|
KS1 Writing |
73 |
18 |
70 |
16 |
|
|
KS1 Maths |
79 |
27 |
76 |
22 |
|
|
KS2 RWM |
71 |
13 |
64 |
10 |
|
|
KS2 Reading |
74 |
32 |
75 |
28 |
-1.1 |
|
KS2 Writing |
77 |
23 |
78 |
23 |
-1.1 |
|
KS2 Maths |
77 |
32 |
76 |
24 |
-0.1 |
|
KS2 GPS |
83 |
50 |
78 |
34 |
|
|
Average Scale Scores |
MDCP |
National |
|
|
|
| Reading |
103.5 |
104 |
|
|
|
| Maths |
105 |
105 |
|
|
|


